
Price Action vs Indicator-based Trading: Which Is Better for Indian Markets?
Finding a reliable price action trading course India offers can feel overwhelming when the wrong choice costs time and capital. For intermediate traders frustrated by lagging indicators and false signals, the real challenge is filtering out the noise to find a system that actually works in live markets.
The good news is that a clearer approach exists. While lagging indicators keep you one step behind by reacting to past data, pure price action allows you to read raw market sentiment in real time. Stripping away cluttered oscillators reveals the exact zones where institutional buyers step in, making your risk management far more precise.
By the end of this breakdown, you will know how to identify institutional footprints, which transition mistakes to avoid, and how to evaluate a mentorship program. You will leave with a practical framework to clean up your charts and trade with genuine confidence.
What Is Price Action Trading vs Indicator-based Trading?
Price action trading focuses on reading raw market data, such as candlestick shapes and support levels, to see exactly what buyers and sellers are doing right now. Indicator-based trading relies on mathematical formulas applied to past prices, which inherently creates a lag. Think of price action as looking out the windshield while driving, whereas relying on indicators is like navigating by looking in the rearview mirror. Manas Arora emphasizes that keeping your charts clean is the best way to build consistency. To stop overcomplicating your trades, exploring the Store is a great first step.
Choosing the right approach matters because cluttered charts cause decision fatigue. When you rely on clean price action, you learn to spot institutional footprints and enter trades with better risk-to-reward ratios. Many beginners stack multiple indicators, only to realize that a solid stock market course should teach them how to read the actual price first. Finding a reliable price action trading course India offers means looking for a training program that prioritizes practical outcomes.
- Price action: Reads current market sentiment.
- Indicators: Analyzes historical data.
The Problem With Indicators: Why You Are Always One Step Behind
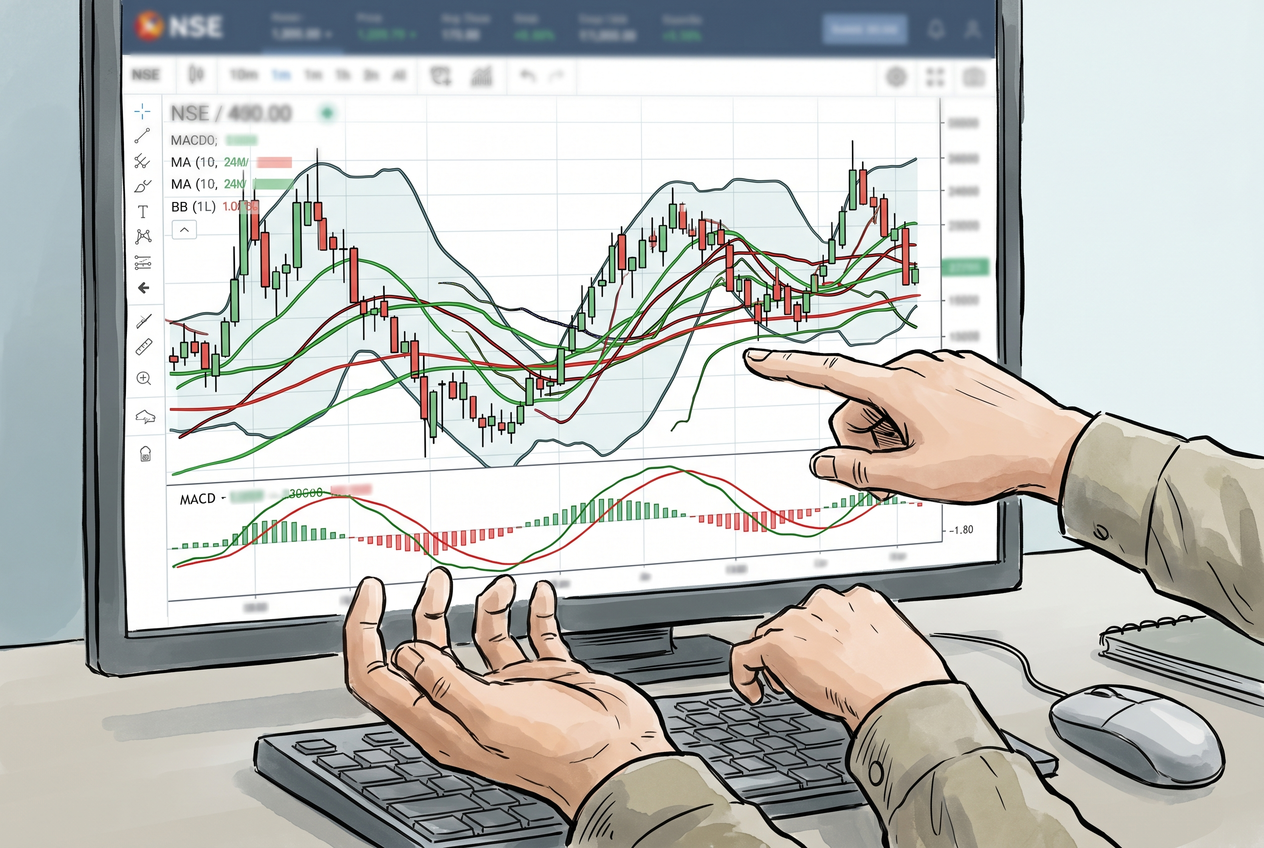
Many beginners still clutter their screens with moving averages and RSI lines, hoping these tools will predict the next big move. The fundamental flaw is that indicators do not move the price; they only react to it. Because every indicator uses past data, it will always lag behind live market action. By the time your indicator finally signals a buy, institutional buyers have already entered the trade, leaving you to buy at the top.
Relying on multiple lagging tools quickly leads to decision fatigue, especially when your indicators contradict each other. This confusion is a common hurdle in professional stock market coaching, where students freeze because their charts give conflicting advice. If you want to see how this delay destroys your risk-to-reward ratio, search for the PBEyuc9jjMU YouTube video breakdown comparing a late indicator entry against a sharp price action setup. A proper stock trading course teaches you to trust raw price data instead of waiting for a delayed signal.
What to Compare Before Choosing a Price Action Trading Course India
Finding the right price action trading course India requires focusing on how the mentor simplifies the market. The best programs teach you to reduce decision fatigue by keeping your screen clean. Removing lagging oscillators forces you to rely on raw price data to spot where big institutions are actually buying. This transition feels uncomfortable at first because you lose the safety net of colorful lines, but the trade-off is entering trades much earlier.
To build consistency, you need a system prioritizing practical outcomes over endless theory. Whether you are exploring the Fast & Fortunate course or searching for the best stock trading course for beginners in India, your goal is finding a framework that explains institutional buying zones. Use this simple checklist to evaluate if the program will help you read the market confidently:
- Visual clarity: Does it show visual examples of indicator lag compared to sharp price action entries?
- Raw data: Are you learning to identify institutional footprints without delayed signals?
- Actionable steps: Does the charting setup guide reduce your daily decision fatigue?
Why Pure Price Action Wins in the Indian Stock Market
Pure price action acts as a direct window into the minds of institutional investors. Stripping away the clutter of lagging indicators reveals the exact zones where smart money is buying. Instead of waiting for a moving average to cross, you spot a strong rejection candle at a key support level and enter immediately. This clean approach leads to faster decision-making and vastly superior risk-to-reward ratios because your stop loss sits right below the actual market structure.
Navigating the volatile swings of the Indian stock market requires this exact clarity. When searching for a swing trading course India, look for mentors who prioritize raw price data. A quality online trading course teaches you to identify these footprints to ride momentum safely.
- Spot the footprint: Look for large candles showing institutional buying.
- Define the risk: Place stop losses tightly below structural lows.
How to Transition to Price Action: a Step-by-step Guide
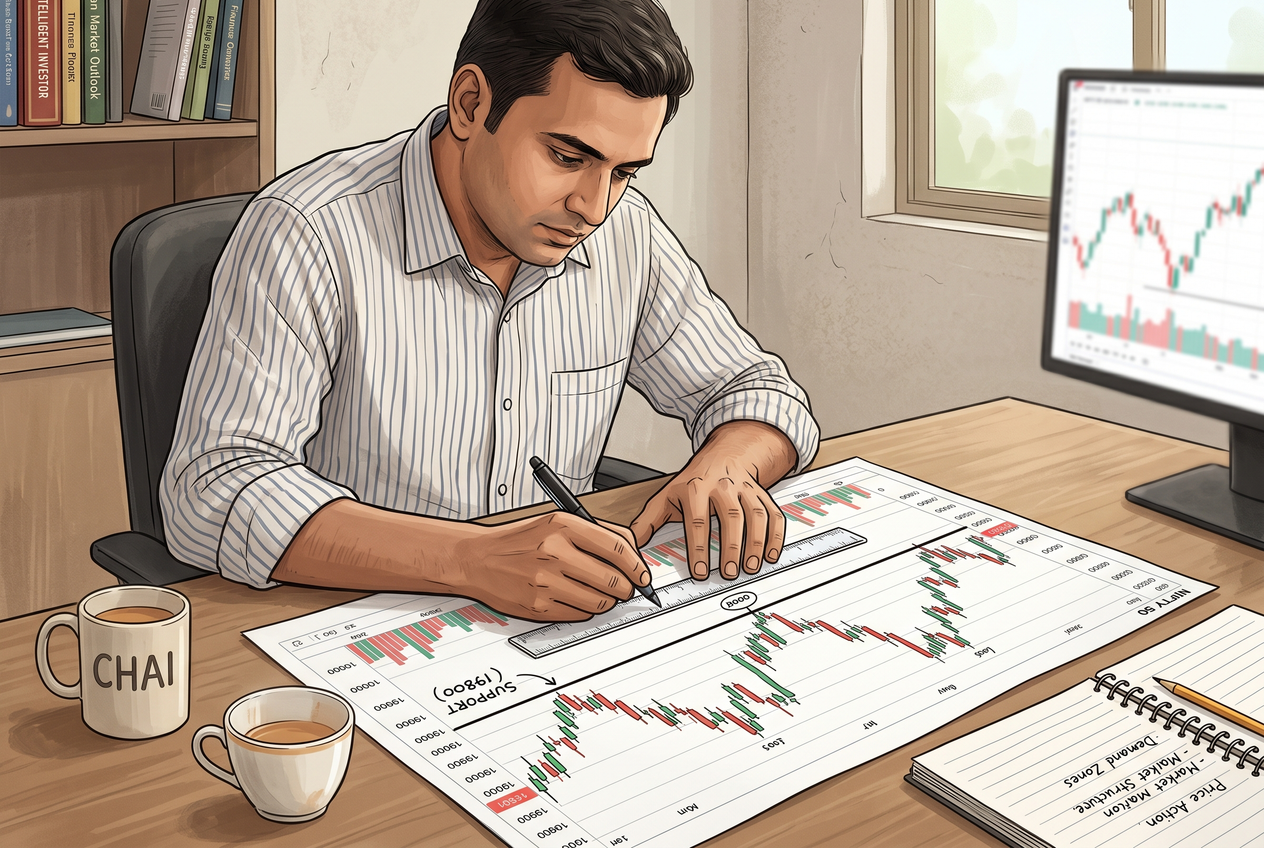
Making the shift to pure price action starts with a simple but uncomfortable step: deleting every indicator from your screen. Think of it like taking off training wheels; it feels wobbly at first, but it is the only way to learn true balance. When you remove the colorful moving averages, you finally see the raw footprint of buyers and sellers.
Once your screen is clean, your next goal is to identify the basic rhythm of the market. You do this by spotting higher highs and lower lows, which tell you the true direction of the trend. From there, mark the obvious support and resistance zones where institutional money steps in.
- Strip your charts: Remove all overlays to reveal raw price data.
- Read market structure: Look for clear higher highs or lower lows.
- Mark key levels: Draw lines at major support and resistance zones.
- Follow a path: Explore the structured learning paths in our Store to build a reliable system.
Top 5 Reasons to Simplify Your Chart Setup Today
Clearing your screen of lagging indicators is the fastest way to see what the market is actually doing. When you rely on too many colorful lines, you freeze at the exact moment you should take action. Think of a clean chart like driving with a clear windshield, while a cluttered chart is like driving in a rainstorm with broken wipers. Simplifying your setup removes this friction.
Making this shift transforms how you approach every trading day. Instead of waiting for indicators to cross, you spot the exact zones where institutions step in. Stripping away the noise unlocks immediate advantages:
- Faster entries and tighter stop losses: You enter trades as the move begins, keeping risk small.
- Reduced mental clutter: Fewer lines mean fewer conflicting signals and less confusion.
- Clearer market psychology: You see the real battle between buyers and sellers.
- Total adaptability: A clean setup works perfectly across all timeframes.
- Institutional alignment: You follow the footprints of smart money rather than retail noise.
Common Mistakes Beginners Make When Switching Strategies
Switching to a clean chart can feel incredibly liberating, but this newfound clarity often leads to a dangerous sense of overconfidence. When you learn stock trading from scratch, you are taught to rely on indicators as safety nets, so removing them might make you feel like you can suddenly predict every market move. This is exactly when traders abandon their risk management rules and start taking random trades just because the price looks good. Instead of forcing trades, you must wait patiently for high-probability setups to form at key levels.
Building a reliable, rule-based system is the only way to survive the inevitable losing streaks that come with any new strategy. You need proper stock market mentorship to help you stay disciplined when the market tests your patience. To keep your psychology in check, follow IManasArora on social media for daily reminders on strict risk management and trading discipline.
- Do stick to a strict stop-loss on every single trade.
- Don't increase your position size just because a pattern looks perfect.
Quick Summary: What Matters Most
Relying on lagging indicators keeps you one step behind the market, forcing you to react to moves that have already happened. When you strip away the colorful lines and focus purely on price action, you start reading raw market sentiment exactly as it unfolds. This clean approach is the foundation of the Manas Arora trading strategy, which teaches you to spot institutional footprints before the crowd catches on.
Making this shift from cluttered screens to clean charts is the fastest way to improve your risk-to-reward ratios. Mastering these core principles will completely change how you view the market.
- Ditch the lag: Indicators tell you what happened yesterday, while price action shows you what big institutions are doing right now.
- Spot the footprints: Look for clean support and resistance zones to enter trades with much smaller stop losses.
- Keep it simple: Reliable technical analysis training prioritizes reading candlestick behavior over memorizing complex oscillator formulas.
FAQ
What Should I Look for in a Price Action Trading Course India?
A high-quality price action trading course India should prioritize raw chart reading over complex indicator setups. Look for mentorship that teaches you how to identify institutional footprints, manage risk effectively, and simplify your decision-making process. Avoid programs that rely on proprietary oscillators or lagging signals.
Why Do Technical Indicators Often Fail in Volatile Indian Markets?
Indicators are mathematical derivatives of past price and volume data. By the time an oscillator generates a buy or sell signal, the actual market move has often already occurred. In volatile markets, this inherent lag results in late entries, wider stop losses, and frequent false signals that trap retail traders.
Can I Completely Remove All Indicators From My Trading Charts?
Yes. Many professional traders operate with completely naked charts, relying solely on candlesticks, volume, and key support or resistance levels. Stripping away moving averages and oscillators reduces decision fatigue and allows you to focus entirely on raw market sentiment and actual price behavior.
How Does Price Action Help Identify Institutional Buying Zones?
Institutional investors trade in massive volumes that leave distinct footprints on a naked chart. Price action helps you spot these zones through rapid price rejections, consolidation breakouts, and specific candlestick formations. Recognizing these patterns allows you to align your entries with smart money rather than fighting the trend.
Is Price Action Trading Suitable for Options Buying in Indian Indices?
Absolutely. Options buying requires precise timing and momentum, which lagging indicators struggle to provide. Price action allows you to enter trades at the exact moment a breakout or reversal occurs, giving you the superior ROI and risk-to-reward ratios necessary to succeed in fast-moving markets.
How Long Does It Take to Transition From Indicator-based to Price Action Trading?
The transition timeline varies, but most intermediate traders begin seeing clearer chart setups within a few weeks of dedicated practice. The hardest part is unlearning the reliance on lagging signals. Consistent screen time and focused mentorship will accelerate your ability to trust raw price data.
Does Price Action Trading Require Me to Monitor the Screen All Day?
No. Once you understand how to mark key institutional zones and daily levels, you can set price alerts and step away. Price action trading is about waiting for the market to reach your predetermined areas of interest, which actually reduces the need for constant, stressful screen monitoring.
Next Step
Join the M-club: the Premium Stock Market Mentorship Community to learn more. Use the points above to pressure-test your fit, clarify trade-offs, and move toward your next step with more confidence and less guesswork.