
Supertrend Indicator
The supertrend indicator looks like magic in a trending market. It paints clear green and red signals on your chart, making buying and selling feel effortless. But if you have ever traded a sideways, consolidating market, you already know the harsh truth. Relying on the supertrend indicator blindly will bleed your trading account dry with rapid, false signals. Here is the reality check every beginner needs. The supertrend indicator is a fantastic training wheel for new traders learning to identify market direction. However, it is a lagging tool based on the Average True Range (ATR). It tells you what has already happened, not what is about to happen. To survive in live markets, you must eventually supplement or replace it with pure price action. This guide explains how to use this tool correctly, when to ignore it, and how to evolve your strategy.
Table of Contents
- What is the supertrend indicator?
- The Trap: Why the supertrend indicator Fails in Ranging Markets
- supertrend indicator vs. Pure Price Action
- 3 Rules for Trading with the supertrend indicator
- Upgrading Your Skills: From Indicators to Professional Mentorship
- Frequently Asked Questions (FAQ)
What is the supertrend indicator?
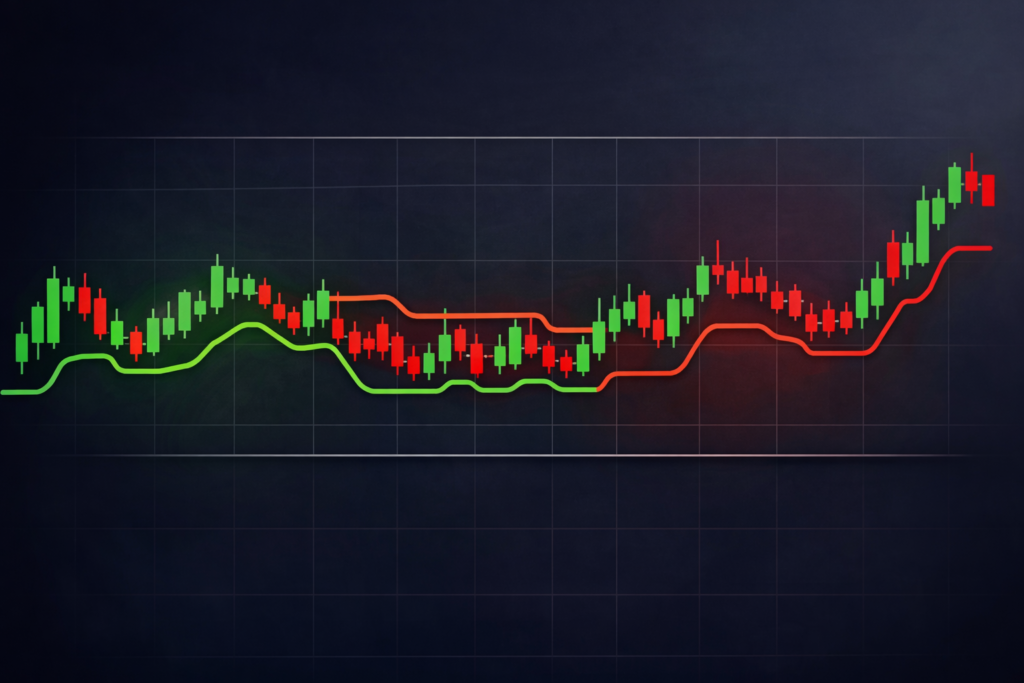
What is the supertrend indicator? The supertrend indicator is a trend-following technical analysis tool that plots directly on the price chart. It uses the Average True Range (ATR) and a multiplier to identify the current market trend, turning green during an uptrend and red during a downtrend.
The Average True Range measures market volatility. By multiplying this volatility, the indicator creates a band above or below the price. When the price breaches this band, the trend direction flips.
For anyone looking to learn stock trading from scratch, this tool offers a simple visual cue that reduces the cognitive load of analyzing raw charts. Green means buy, red means sell.
However, do not mistake simplicity for a complete strategy. While many search for the best supertrend indicator settings, the math remains the same. It is a lagging indicator. It reacts to past volatility and price movement rather than predicting future action.
If you are taking stock market courses for beginners, you will often see this tool introduced early. It helps new traders stay on the right side of a strong trend and prevents them from counter-trend trading. But as you progress, you will realize that indicators are just the starting point of a much deeper journey.
Ready to move beyond basic indicators? Explore our courses at Manas Arora and build a robust trading foundation.
The Trap: Why the supertrend indicator Fails in Ranging Markets
The biggest reason why traders lose money is applying the right tool in the wrong market environment. The supertrend indicator thrives when a stock is making clear higher highs or lower lows. It captures the meat of the move beautifully.
But markets only trend about 30% of the time. The rest of the time, they consolidate in a sideways range, building cause for the next major move.
In a ranging market, the indicator will generate rapid, conflicting buy and sell signals. This is known as whipsawing. You buy on a green signal, the market immediately reverses, and you sell on a red signal for a loss. If you take every signal blindly, the constant small losses and trading fees will destroy your capital.
This is why a basic stock trading course is never enough. You need to understand market context. Knowing how to manage risk in trading means knowing when to sit on your hands and ignore the indicator entirely. It requires the discipline to recognize a range and wait for a confirmed breakout.
Many beginners look for a supertrend indicator guide hoping for a secret setting that works in all markets. There is no such thing. Even the most expensive supertrend indicator pricing models or premium scripts cannot fix the fundamental flaw of lagging math.
supertrend indicator vs. Pure Price Action
To truly understand market dynamics, we must compare indicator-based trading with pure price action. This is a critical transition for anyone seeking an advanced stock market course.
Indicators tell you what happened. Price action tells you what is happening right now.
When you rely solely on the supertrend indicator, your entry is delayed. You are waiting for the ATR formula to catch up to the price drop or surge. By the time the line turns green, the optimal entry point has often passed, and your stop loss is now much wider, ruining your risk-to-reward ratio.
In contrast, a trader who understands price action is proactive. They know how to trade breakouts before the lagging indicator even registers the move. They read candlestick patterns, volume anomalies, and support/resistance zones to anticipate the shift in momentum.
Does this mean you should delete all indicators? Absolutely not. Position them as beginner tools that must eventually be replaced or supplemented by price action. Use the indicator as a secondary filter, not your primary trigger. Let price action dictate the entry, and let the indicator confirm the trend.
3 Rules for Trading with the supertrend indicator
- Only trade in confirmed trending markets. Before looking at the indicator, zoom out to a higher timeframe. Is the stock making higher highs and higher lows? If yes, the indicator can help you ride the trend. If the market is chopping sideways between two obvious levels, ignore the signals completely. Context is king.
- Combine it with price action filters. Never use the indicator as a standalone strategy. Combine it with volume analysis and key support/resistance levels. If the indicator flashes green right below a major resistance zone, price action dictates that you wait.
- Use it to trail stop losses, not just for entries. One of the best uses of this tool is trade management. Once you are in a profitable trade, use the indicator line as a dynamic trailing stop loss to lock in profits.
Upgrading Your Skills: From Indicators to Professional Mentorship
Eventually, every trader hits a plateau. You realize that a theoretical stock market course alone won’t make you profitable if you lack live-market discipline and real-time feedback.
A dedicated stock market mentorship provides the real-time feedback you need. Free videos can teach concepts, but not execution psychology.
If you are a busy individual, finding the best trading course for working professionals is crucial. Swing trading allows you to analyze the markets after hours without watching screens all day.
The Manas Arora stock market course and mentorship focus on transitioning from indicators to real price action.
Frequently Asked Questions (FAQ)
What are the best settings for the supertrend indicator?
The default settings are usually a period of 10 and a multiplier of 3.
Can the supertrend indicator be used for intraday trading?
Yes, but it produces false signals in choppy markets and must be combined with price action.
Which indicator works best with the supertrend indicator?
RSI and MACD work well, but price action is the best confirmation tool.
Is an online trading course enough to make me profitable?
It provides knowledge, but profitability requires practice, discipline, and risk management.
How do I transition from indicators to price action?
Start by removing indicators and focusing on market structure and key levels.
Where can I find reliable technical analysis training?
Visit Manas Arora for structured training and mentorship.